- We will send in 10–14 business days.
- Author: Howard Wainer
- Publisher: Copernicus Books
- ISBN-10: 1461274869
- ISBN-13: 9781461274865
- Format: 21 x 27.9 x 1.1 cm, minkšti viršeliai
- Language: English
- SAVE -10% with code: EXTRA
Reviews
Description
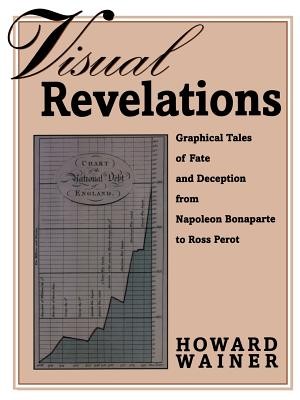
This extraordinary book provides a journey through the jungle of good and bad graphical devices used to illustrate and obfuscate data. The diversity of examples is tremendous: ranging from Napoleon's retreat from Moscow to the O-rings on the space shuttle and from mortalities in hospitals to the schedules of buses. The author's aim is to illustrate how effectively a well-chosen graphic can reveal in an instant the essential truth behind some data whilst a poorly designed representation can conceal an awful truth. As well as providing numerous examples of both, the author includes plenty of helpful ideas to make us all better producers and consumers of graphics.
EXTRA 10 % discount with code: EXTRA
The promotion ends in 23d.10:17:06
The discount code is valid when purchasing from 10 €. Discounts do not stack.
- Author: Howard Wainer
- Publisher: Copernicus Books
- ISBN-10: 1461274869
- ISBN-13: 9781461274865
- Format: 21 x 27.9 x 1.1 cm, minkšti viršeliai
- Language: English English
This extraordinary book provides a journey through the jungle of good and bad graphical devices used to illustrate and obfuscate data. The diversity of examples is tremendous: ranging from Napoleon's retreat from Moscow to the O-rings on the space shuttle and from mortalities in hospitals to the schedules of buses. The author's aim is to illustrate how effectively a well-chosen graphic can reveal in an instant the essential truth behind some data whilst a poorly designed representation can conceal an awful truth. As well as providing numerous examples of both, the author includes plenty of helpful ideas to make us all better producers and consumers of graphics.


Reviews