- We will send in 10–14 business days.
- Author: John J Murphy
- Publisher: Wiley
- ISBN-10: 0470382058
- ISBN-13: 9780470382059
- Format: 15.5 x 22.9 x 3.6 cm, kieti viršeliai
- Language: English
- SAVE -10% with code: EXTRA
Reviews
Description
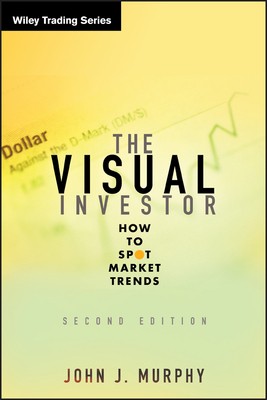
The Visual Investor, Second Edition breaks down technical analysis into terms that are accessible to even individual investors. Aimed at the typical investor--such as the average CNBC viewer--this book shows investors how to follow the ups and downs of stock prices by visually comparing the charts, without using formulas or having a necessarily advanced understanding of technical analysis math and jargon. Murphy covers all the fundamentals, from chart types and market indicators to sector analysis and global investing, providing examples and easy-to-read charts so that any reader can become a skilled visual investor.
EXTRA 10 % discount with code: EXTRA
The promotion ends in 22d.23:37:44
The discount code is valid when purchasing from 10 €. Discounts do not stack.
- Author: John J Murphy
- Publisher: Wiley
- ISBN-10: 0470382058
- ISBN-13: 9780470382059
- Format: 15.5 x 22.9 x 3.6 cm, kieti viršeliai
- Language: English English
The Visual Investor, Second Edition breaks down technical analysis into terms that are accessible to even individual investors. Aimed at the typical investor--such as the average CNBC viewer--this book shows investors how to follow the ups and downs of stock prices by visually comparing the charts, without using formulas or having a necessarily advanced understanding of technical analysis math and jargon. Murphy covers all the fundamentals, from chart types and market indicators to sector analysis and global investing, providing examples and easy-to-read charts so that any reader can become a skilled visual investor.


Reviews