- We will send in 10–14 business days.
- Author: William G Jacoby
- Publisher: SAGE Publications, Inc
- ISBN-10: 0761908994
- ISBN-13: 9780761908999
- Format: 15.2 x 20.3 x 0.7 cm, minkšti viršeliai
- Language: English
- SAVE -10% with code: EXTRA
Statistical Graphics for Visualizing Multivariate Data, Volume 120 (e-book) (used book) | bookbook.eu
Reviews
Description
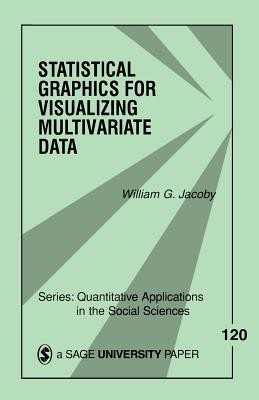
This book explores a variety of graphical displays that are useful for visualizing multivariate data. The basic problem involves representing information that varies along several dimensions when the display medium (a computer screen or printed page) is inherently two-dimensional. In order to address this problem, William G Jacoby introduces the concept of a `data space′.
EXTRA 10 % discount with code: EXTRA
The promotion ends in 22d.17:57:54
The discount code is valid when purchasing from 10 €. Discounts do not stack.
- Author: William G Jacoby
- Publisher: SAGE Publications, Inc
- ISBN-10: 0761908994
- ISBN-13: 9780761908999
- Format: 15.2 x 20.3 x 0.7 cm, minkšti viršeliai
- Language: English English
This book explores a variety of graphical displays that are useful for visualizing multivariate data. The basic problem involves representing information that varies along several dimensions when the display medium (a computer screen or printed page) is inherently two-dimensional. In order to address this problem, William G Jacoby introduces the concept of a `data space′.


Reviews