- We will send in 10–14 business days.
- Author: William G Jacoby
- Publisher: SAGE Publications, Inc
- ISBN-10: 0761900837
- ISBN-13: 9780761900832
- Format: 15.2 x 20.5 x 0.7 cm, minkšti viršeliai
- Language: English
- SAVE -10% with code: EXTRA
Statistical Graphics for Univariate and Bivariate Data (e-book) (used book) | bookbook.eu
Reviews
Description
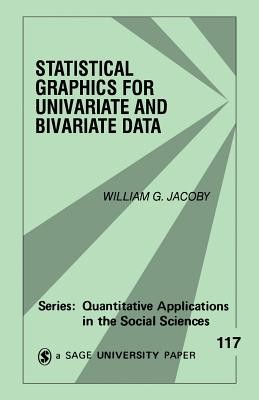
Graphical displays that researchers can employ as an integral part of the data analysis process are frequently more revealing than traditional, numerical summary statistics. Providing strategies for examining data more effectively, this volume focuses on: univariate methods such as histograms, smoothed histograms, univariate scatterplots, quantile plots, box plots, dot plots. It describes bivariate methods such as scatterplot construction guidelines, jittering for overplotted points, marginal boxplots, scatterplot slicing, the Loess procedure for nonparametric scatterplot smoothing, and banking to 45 degrees for enhanced visual perception.
EXTRA 10 % discount with code: EXTRA
The promotion ends in 22d.23:43:02
The discount code is valid when purchasing from 10 €. Discounts do not stack.
- Author: William G Jacoby
- Publisher: SAGE Publications, Inc
- ISBN-10: 0761900837
- ISBN-13: 9780761900832
- Format: 15.2 x 20.5 x 0.7 cm, minkšti viršeliai
- Language: English English
Graphical displays that researchers can employ as an integral part of the data analysis process are frequently more revealing than traditional, numerical summary statistics. Providing strategies for examining data more effectively, this volume focuses on: univariate methods such as histograms, smoothed histograms, univariate scatterplots, quantile plots, box plots, dot plots. It describes bivariate methods such as scatterplot construction guidelines, jittering for overplotted points, marginal boxplots, scatterplot slicing, the Loess procedure for nonparametric scatterplot smoothing, and banking to 45 degrees for enhanced visual perception.


Reviews