- We will send in 10–14 business days.
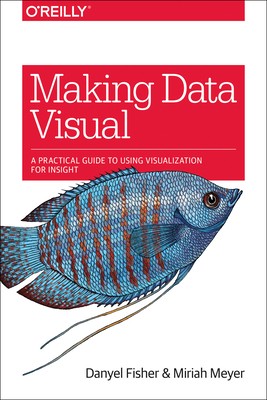
- Author: Danyel Fisher
- Publisher: O'Reilly Media
- ISBN-10: 1491928468
- ISBN-13: 9781491928462
- Format: 15.2 x 22.6 x 0.8 cm, minkšti viršeliai
- Language: English
- SAVE -10% with code: EXTRA
Reviews
Description
You have a mound of data front of you and a suite of computation tools at your disposal. Which parts of the data actually matter? Where is the insight hiding? If youâ re a data scientist trying to navigate the murky space between data and insight, this practical book shows you how to make sense of your data through high-level questions, well-defined data analysis tasks, and visualizations to clarify understanding and gain insights along the way.
When incorporated into the process early and often, iterative visualization can help you refine the questions you ask of your data. Authors Danyel Fisher and Miriah Meyer provide detailed case studies that demonstrate how this process can evolve in the real world.
Youâ ll learn:
- The data counseling process for moving from general to more precise questions about your data, and arriving at a working visualization
- The role that visual representations play in data discovery
- Common visualization types by the tasks they fulfill and the data they use
- Visualization techniques that use multiple views and interaction to support analysis of large, complex data sets
EXTRA 10 % discount with code: EXTRA
The promotion ends in 22d.17:57:57
The discount code is valid when purchasing from 10 €. Discounts do not stack.
- Author: Danyel Fisher
- Publisher: O'Reilly Media
- ISBN-10: 1491928468
- ISBN-13: 9781491928462
- Format: 15.2 x 22.6 x 0.8 cm, minkšti viršeliai
- Language: English English
You have a mound of data front of you and a suite of computation tools at your disposal. Which parts of the data actually matter? Where is the insight hiding? If youâ re a data scientist trying to navigate the murky space between data and insight, this practical book shows you how to make sense of your data through high-level questions, well-defined data analysis tasks, and visualizations to clarify understanding and gain insights along the way.
When incorporated into the process early and often, iterative visualization can help you refine the questions you ask of your data. Authors Danyel Fisher and Miriah Meyer provide detailed case studies that demonstrate how this process can evolve in the real world.
Youâ ll learn:
- The data counseling process for moving from general to more precise questions about your data, and arriving at a working visualization
- The role that visual representations play in data discovery
- Common visualization types by the tasks they fulfill and the data they use
- Visualization techniques that use multiple views and interaction to support analysis of large, complex data sets


Reviews